

Machine Learning Puts Nanomaterials In The Picture
20/05/2019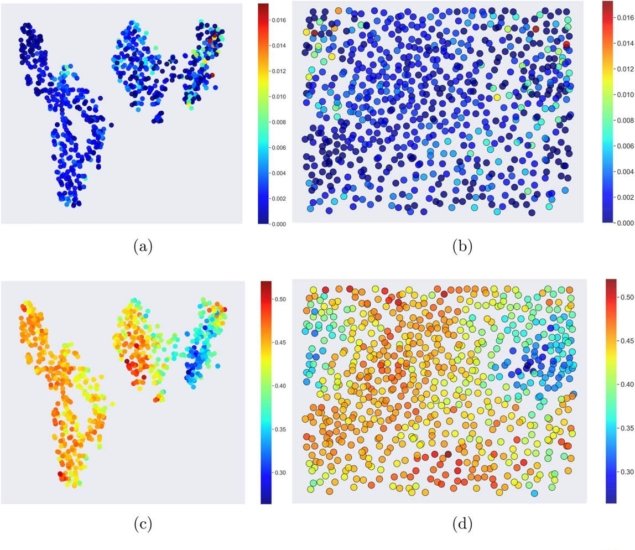 t-SNE (left) and SOM (right) plots of the platinum nanoparticle using different the structured features.
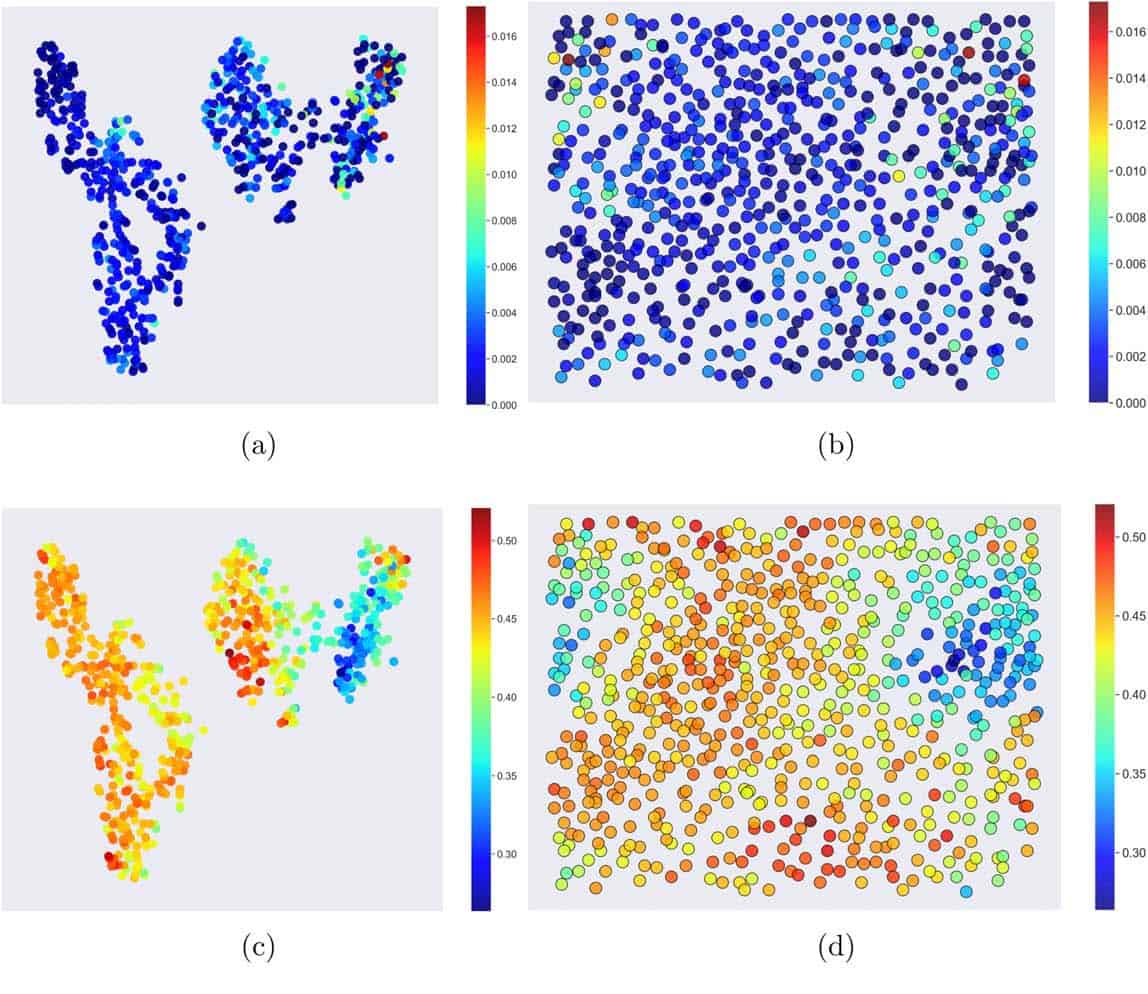
The rich properties of nanomaterials can be a bane as much as a bonus to researchers keen to put them to good use. “Nanomaterials have all the challenges of molecules (such as finite sizes, surfaces and chemical functionalization), combined with the complexity of materials (such as defects, impurities and disorder),” explains Amanda Barnard, Chief Research Scientist in Data61 at the Commonwealth Scientific and Industrial Research Organisation (CSIRO) in Australia. “Machine learning is a powerful way to navigate that complexity and include all of these features in our predictions.”
Reporting in Journal of Physics: Materials Barnard and CSIRO colleague Baichuan Sun show that dimension reduction algorithms used in bioinformatics, finance, transport and social science can also help materials scientists to visualize data with a large number of defining features – descriptors – and so help to identify patterns in the structure-function relationships.
These algorithms have largely gone below the radar of materials scientists as they were not developed with these applications in mind. However as the materials science specialists of a group specializing in data science and machine learning, Barnard and Sun are exposed to a far wider range of data tools than most researchers in groups specializing in materials science.
“’Nanoinformatics’ (the use of data science and machine learning to explore the complex structure/property relationships in nanoscale materials) is just starting to emerge,” explains Barnard. However she foresees it claiming increasing prominence in nanomaterials studies to tackle their complexity. “Traditionally structure/property relationships are based on researcher assumption or intuition and then deliberately measured and plotted to confirm a trend. Machine learning needs no input assumption and if a relationship (pattern) exists in the data it will naturally emerge, regardless of whether it was foreseen and targeted in the original series of experiments or simulations.”
In particular, Barnard highlights the advantage of the dimension reduction algorithms she and Sun have been working with, which help researchers “see” the characterization results recording a range of properties and features in different types of nanoparticles. “Humans are very good at visual pattern recognition, and researchers with an intimate familiarity with their material and data would be remiss not to draw on this ability as part of their research.”
Characterization cartography
Among the characteristics defining a nanoparticle are the structural features such as the shape, volume, the fraction of face centred cubic atoms or the concentration of defects, as well as behaviour properties that might include the ionization potential, electron affinity or bandgap. Preparation parameters like the growth time or rate and temperature are also defining features.
The data sets Barnard and Sun worked from included these characteristics as well as many more. All these characteristics equate to a large number of dimensions for each data point. By generating 2D maps of nanoparticles encoded by one characterizing feature at a time, while reducing the dimensionality of the data, the researchers could easily compare 2D maps to pick out trends.
Algorithms that can reduce the dimensionality of this kind of data into 2D maps include t-distributed stochastic neighbour embedding (t-SNEs) and self-organisation maps (SOMs), also referred to as Kohonen networks. Maps based on the SOM algorithm comprise a grid of units that act as “neurons”. Each neuron starts with a random value. In the machine learning stage, for each data point recorded, the algorithm searches the grid for the unit that best matches its value by taking differences.
The value of the neuron at this “best matching unit” and those close to it are then updated to “weight” it with respect to the matching data. The t-SNE is similar in some ways but weights its grid based on probabilities and so distances and directions on the map rendered are not as meaningful.
Barnard and Sun use both algorithms on two sets of data – one for silver nanoparticles and one for platinum nanoparticles. They show how they can identify structure/function relationships using both algorithms. “Some of the structure/property relationships we identify in this paper were already known (and were an important test that these methods can predict the right answer when we already know what it is) and some were more nuanced, and previously hidden because the curse of dimensionality prevented straightforward interpretation using conventional methods,” Barnard tells Physics World.
The SOM advantage
Barnard points out that one of the biggest limitations in the identification of structure/property relationship in materials and nanoscience is that data sets are typically biased by the pre-selection scientists undertake when targeting specific applications. Machine learning can amplify these biases.
Barnard and Sun show that here the SOM algorithm may have advantages, because over representation of a particular feature does not affect the performance of the SOM algorithm. In addition, it generates maps of continuously dispersed data, whereas the t-SNE maps tend to have clusters that can be misleading. Future work will look further into which of the methods that computer scientists have developed are best suited to deal with the types of problems that arise in materials science research.
Full details are reported in the Advanced Material Modelling, Machine Learning and Multiscale Simulation focus collection of Journal of Physics: Materials.
Source: https://bit.ly/2W7LeIx via PhysicsWorld
Conteúdo Relacionado:
GC